Lesson 11b: How do we know it’s fossil fuel burning?

As I was writing about carbon dioxide levels rising in the previous post, I began asking myself what evidence we have to support that the rise is caused by fossil fuel burning by us – rather than from natural causes. That set me off down different paths – which I’ll explore with you here. I’m not an expert on any of these topics, but I know how to think about things in a scientific way – so here are my explorations.

radiocarbon_sub1
Principles of carbon dating. Image from http://rses.anu.edu.au/services/anu-radiocarbon-laboratory/radiocarbon-dating-background

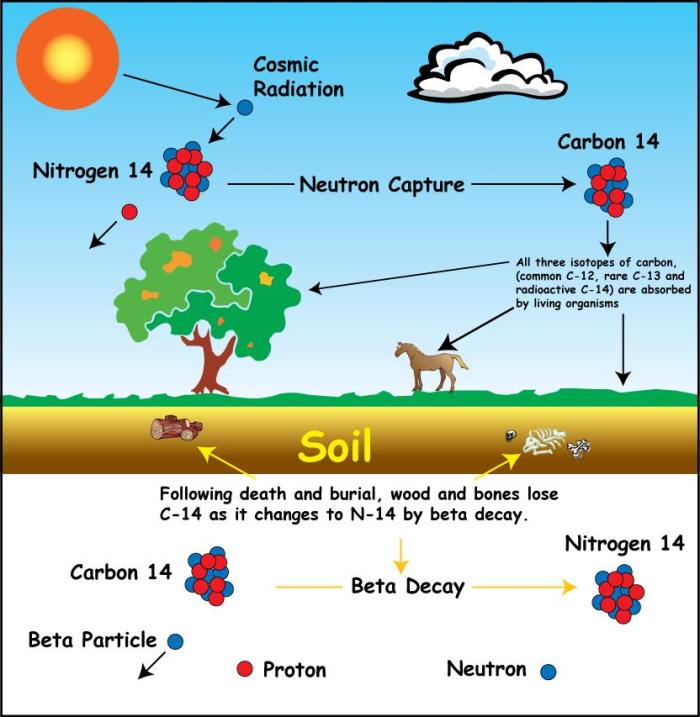
First, I wondered about whether the carbon dating techniques would teach us about this. Carbon dating is a technique used to work out how old wooden objects are. It works like this: In the upper atmosphere, nitrogen atoms are hit by cosmic rays and are converted into carbon-14 (carbon atoms with 6 protons and 8 neutrons). Carbon-14 is radioactive and it decays, slowly, back to nitrogen (7 protons, 7 neutrons). If you have a large number of carbon-14 atoms, then after ~5730 years, half of them have decayed back to nitrogen (that’s what a half-life means). In the atmosphere, the cosmic rays keep making new carbon-14 atoms. A growing tree will take in carbon-14 as well as the other isotopes of carbon (carbon-12 and carbon-13) from the atmosphere while it is alive. Once it dies, there is no more carbon-14 coming in from the atmosphere but the carbon-14 that is in the wood continues to decay into nitrogen. So, if a boat or a chair was made from a tree, you can tell how old it is by seeing how much carbon-14 is left in it. Every ~5730 years the amount of carbon-14 halves.

Now, fossil fuels are fuels made from fossilised wood that grew hundreds of millions of years ago. So, there have been many, many half-lives that have passed, and there is no carbon-14 left. I wondered whether, as a result of us burning fossil fuels, the amount of carbon-14 in the air is noticeably lower than it “should be”?

I read quite a few online documents and scientific papers and discovered a couple of things – first that in the early 20th century there was a noticeable “ageing” of the atmosphere – it looked older than it should have done. But then we really messed up the readings by setting off lots and lots of atomic bombs.

Hemispheric_14C_graphs_1950s_to_2010
Image from Wikipedia article. I’m not sure what the vertical axis really means because carbon-14 is never several percent of the carbon, but while I think they’ve missed off a scaling factor, or not explained what it is a percentage of, the shape tells a powerful story – atmospheric carbon-14 went up when we released nuclear bombs

However, that’s now dropping and the scientific paper I found suggests that by 2050 brand new wood might look like it grew in 1050! I’m not completely sure whether that’s based on measurement or projection making the assumption that humans are emitting fossil carbon, but it does provide some evidence that you could test.

There’s also another carbon isotope, carbon-13. This is not radioactive, so doesn’t decay. From that you can tell something about the origin of the material. Photosynthesis affects the ratio of carbon-13 to carbon-12 as it prefers one to the other (I’m massively out of my depth with this chemistry and biology, so I’ll stop there – but apparently there are two types of photosynthesis). Whereas geological processes have no such bias. Therefore, if something was ever a plant, or ate a plant, the ratio is different than if it came from rocks. As a result you can distinguish fossil fuel carbon (from 100s of millions of years old trees that had photosynthesis) from volcano carbon. And the increase in carbon dioxide in the atmosphere shows it comes from plants – but ones that are old enough for carbon-14 to decay: in other words, fossil fuels.

We attempt to track carbon dioxide from volcanoes. There is no where near enough. Even if we’re a lot wrong in that, it’s not enough.

Also the oxygen levels are decreasing at the rate you’d expect if we were burning things. And we know carbon dioxide levels are increasing in the ocean, so it’s not ocean outgassing.

Other evidence that the increase in carbon dioxide comes from us comes from a simpler source – we know how much fossil fuel we’ve dug or pumped out of the ground. Because it has a monetary value, we actually track that very carefully. Basic chemistry tells us that carbon dioxide is a combustion product when we burn fossil fuels (we can also measure that in a laboratory easily). So we can calculate how much increase we’d expect.  The increase in carbon dioxide in the atmosphere is quite a lot lower than what we’d expect from that simple calculation. That’s because the oceans and the trees have taken up a lot of our emissions. But not all. And measurements over them (e.g. by those satellites we talked about in the last lesson) show that they are now absorbing less (the oceans are “saturating” and simply can’t take any more and we’re cutting down, rather than planting, forests). The global climate budget tries to track and measure all this.

(I promise a later blog called “But dinosaurs didn’t drive SUVs” to discuss why carbon dioxide levels were much higher in their days without us).


Lesson 11: Carbon dioxide measurements from Mauna Loa

co2_data_mlo
Obtained from https://www.esrl.noaa.gov/gmd/ccgg/trends/full.html. This shows the atmospheric carbon dioxide measurements from the Mauna Loa Observatory

Today I’d like to talk a bit about the observations of climate change. Observations are used both to set up climate models and to test them. That is a bit circular – and where independent data sets exist, different data sets are used for these two roles – but usually the observations are used to tune the model using a method called “data assimilation” which is a mathematical process that tries to minimise the average difference between prediction and observation.

There are three types of observation we need to consider: observations of the quantities that affect the climate, observations of the changing climate and observations of the effects of changing climate. In practice, these three categories are blurred (many observations are both cause and effect).

Today we’ll consider the first of these, and in particular the graph that was published widely in the last week because it measured the highest carbon dioxide levels yet: the Mauna Loa observation of carbon dioxide levels in the atmosphere. As we considered in lesson 7, carbon dioxide is a powerful greenhouse gas that affects the Earth’s radiative energy balance (though not in a simple manner). The Mauna Loa Observatory is on a volcano in Hawaii – right in the middle of the Pacific, and, most significantly, a very, very long way from any meaningful industry. The instruments are at the top of the mountain – 3397 m above sea level – again conditions that keep the observations pure. The observatory has measured carbon dioxide daily since March 1958 by taking samples of air and analysing which gases are inside them.

There is an excellent video at https://youtu.be/gH6fQh9eAQE, which I will embed here:

In the video you can see the observations of carbon dioxide from observatories since 1989. The red dot is Mauna Loa (the black dots are other stations around the world – over time the number of black dots changes as stations come in and out of operation). The upward trend is clear – and this has to be factored into the climate models. The zig-zag pattern is due to the seasons – and in particular due to the summer leaf growth in the northern hemisphere which temporarily removes carbon dioxide from the atmosphere. But the unceasing upward trend behind this is because we’re burning fossil fuels (and, to a more minor extent, because we’re cutting down forests and there are more forest fires).

One problem with these observations is that they are made at only a few sites and these sites are intentionally chosen to be well away from the places where fossil fuels are burnt. There are some satellites that are now measuring global CO2 levels – and these can show where the CO2 is. These work by observing the absorption of the spectrum (seeing how black the black lines are) of sunlight reflected by the Earth in wavelengths we know carbon dioxide absorbs (see back to earlier lessons). In particular they make measurements in a “weak-CO<sub>2<\sub>” band, a “strong-CO<sub>2<\sub>” band and an oxygen O<sub>2<\sub> band. The strong band is a band where carbon dioxide strongly absorbs: this band gives information about the overall absorption of carbon dioxide. The weak band is one where carbon dioxide only partly absorbs. This means it goes through most of the atmosphere undisturbed and gives information about carbon dioxide absorption near the surface: in other words it gives information about whether the surface is a source (e.g. factory) or sink (e.g. forest) of carbon dioxide and to what extent. The oxygen band is a reference band to compare the carbon dioxide against.

The main current CO2 sensor is the NASA OCO-2 satellite which has run since 2014 (OCO failed on launch in 2009).

You can get a video of OCO-2’s observations on YouTube too (https://youtu.be/x1SgmFa0r04)

There’s a joint French-British satellite mission called Microcarb that is currently being built to be launched in 2021 that will also perform satellite-based carbon dioxide measurements.

Lesson 7: Carbon dioxide as a greenhouse gas

Lesson 7: Carbon dioxide as a greenhouse gas
CO2_H2O_absorption
Photo found on web, attributed to Robert Rohde’s “Global Warming Art” which I can’t find a live link to.

I showed the picture above in the previous lesson and discussed how water vapour absorbs a very broad set of wavelengths in the thermal infrared (and a few in the near infrared). This absorption is due to how the light of those wavelengths causes the water molecules to change their vibrational modes in lots and lots of different ways.

The carbon dioxide molecule has three atoms arranged in a straight line: a carbon atom in the middle and two oxygen atoms either side. It doesn’t have quite as many ways of vibrating as water, but it has quite a few – and crucially different ones (pink in the diagram above), so it absorbs thermal infrared at wavelengths that water vapour cannot respond to. Thus, carbon dioxide removes even more wavelengths that the Earth can use to cool down in outgoing radiation.

In the last lesson, I also described the water feedback loops – simplistically if there’s too much water vapour in the atmosphere it rains. More completely, a higher temperature means both more water vapour in the atmosphere as hot air holds more water – creating more heating – and it means more clouds which may either accelerate warming (trapping heat in at night), or slow down warming (reflecting more sunlight in the day time) – but we’re not quite sure which.

We are increasing the amount of carbon dioxide in the atmosphere (we’ll come back to the evidence for that later – but basically, for most of the last ten thousand years there were 250-280 carbon dioxide molecules in a million air molecules and now there are 400). And there isn’t a feedback loop as simple and immediate as “rain” to get rid of it. There are ways it can naturally come out of the atmosphere: the main ones are increased plant growth (eg in rainforests) and increased ocean algae. The oceans can also absorb some carbon dioxide, but that makes them more acidic which impacts marine life – particularly corals. Of course, if we’ve cut down the rainforests (which we really have) they can’t absorb as much carbon dioxide either.

Because I’m still taking about the basic physics, I want first to consider what the increased carbon dioxide (wherever it comes from) does.

Now you might think that’s easy – CO2 is a greenhouse gas so more CO2 means more warming; but that isn’t directly true. The atmosphere is very thick – so the thermal infrared meets lots of carbon dioxide molecules on the way up: that means that the atmosphere already absorbs all the light at some wavelengths (the ones where the graph above touches the top of the image). Increasing the concentration of carbon dioxide might make it be fully absorbed slightly earlier, but you can’t be more absorbed than fully absorbed (and at some wavelengths it only takes 25 metres of air to block the light completely).

Instead there are two important effects. The easier effect to understand is that not all infrared wavelengths are completely blocked by the atmosphere. In the last lesson I showed a graph of atmospheric absorption zoomed in and there you see lots and lots of thin lines. As the concentration of carbon dioxide in the atmosphere increases, some of those lines get broader, and some of them get deeper. For example, some wavelengths represent changes from an unusual vibrational mode to another, that are rarely “set up” – it’s rare for the light to meet a molecule in the right starting state, but when there are more carbon dioxide molecules, the light is more likely to find one of these rare molecule vibrational states, so those wavelengths are more frequently absorbed and the absorption line deepens.

The more subtle effect is that the atmosphere itself is also lots of little blackbodies radiating thermal infrared blackbody spectra that depends on the temperature of the gases. (As the thermal infrared radiation is absorbed by the carbon dioxide and water vapour in the atmosphere it heats the atmosphere up).

At low altitudes, any infrared emitted by the atmosphere is absorbed by the carbon dioxide molecules and can’t make it through. But there is a height where the atmosphere can radiate to space because there aren’t enough carbon dioxide molecules above it. Increasing the concentration of carbon dioxide means more molecules throughout the atmosphere and therefore this level has to go up towards space (at the lower height where light once could escape it now is more likely to hit other molecules and therefore not escape). Since the higher parts of the atmosphere are colder, there is less energy escaping to space than would be there at lower levels (smaller blackbody curve at lower temperatures) – so the planet loses less heat.

co2SaturationMyth_Atmosphere_med
Image from: https://skepticalscience.com/graphics.php?g=104

Eek. Sorry. I could have over-simplified this: more CO2 means more greenhouse warming. But I want to try to explain the whole story as I understand it (I am not an expert on climate modelling, so there are still huge simplifications in here I don’t know about!)

One last point: water vapour and carbon dioxide are not the only greenhouse gases. Methane is another important one – with four hydrogen atoms round a carbon atom, it has a lot of vibrational modes – but there’s not as much of it in the atmosphere as there is carbon dioxide. It is also increasing. The refrigerants (HFCs, HCFCs, CFCs) don’t only damage the ozone layer (ozone has vibrational modes that block UV on the way in) but are also very potent greenhouse gases – partly because they don’t occur naturally so they absorb wavelengths nothing is absorbing already. There are currently very low levels of these, but if we don’t dispose of our old refrigerators and air conditioning units carefully we’ll release them into the atmosphere and because there is no absorption at these wavelengths already – a small increase makes a big difference. Just think about how many air conditioning units there are – and the human feedback loop: more warming, more air conditioning, more refrigerant gases, more warming… (that’s why Project Drawdown puts disposing of refrigerant gases carefully as their number 1 activity for solving climate change problems).